Word Study Sankey Chart
Last updated: Jul 08, 2023
Overview
I am currently taking a break from the high computing power of R libraries and learning how these these tools can practically work in other applications.
One such chart is the Sankey Chart. I decided to make one using Visual Basic for my bible word study.
Sankey charts really help do bible word studies (i.e. text mining) since it helps see what counting word usage (translations) alone cannot.
Example Word Study
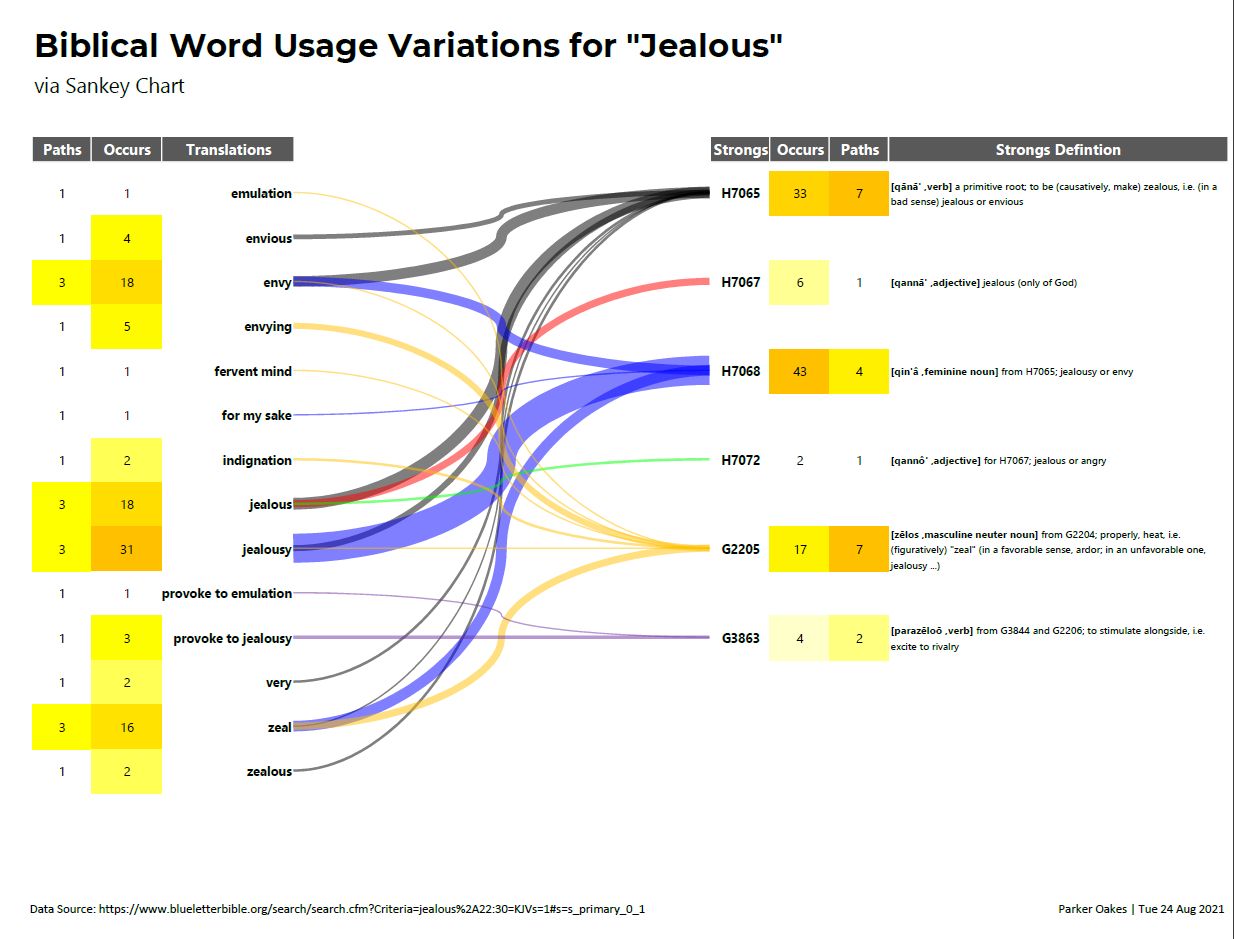
For example, each biblical use of the word “jealous” is important in its own way. Its is used in the Hebrew as a verb, adjective and a noun. In the Greek its both a noun and a verb.
Some translations are confined with just a few words and some with many, all with their own context. “Jealousy” is shown in the Bible so differently as a powerful aspect of God and yet as also “rottenness of the bones (Pro 14:30)”.
Word Study Correlations
VBA Sankey Chart
Here is the code to try it yourself:
Sub sankeyCluster()
  Dim i As Long, clstClr As Long, clust As String
  Dim src As Range, tgt As Range, wgt As Long, maxWgt As Long
  Dim bgnX As Single, bgnY As Single, endX As Single, endY As Single

  maxWgt = Application.WorksheetFunction.Max(Sheet4.Range("$C:$C"))
  Rows("4:17").RowHeight = 40

  For i = 2 To 23
    wgt = Sheet4.Range("C" & i).Value
    Set src = Sheet12.Range(Sheet4.Range("E" & i).Value)
    Set tgt = Sheet12.Range(Sheet4.Range("F" & i).Value)

    bgnX = src.Left
    bgnY = src.Top + (src.Height / 2)
    endX = tgt.Left
    endY = tgt.Top + (tgt.Height / 2)

    clust = Sheet4.Range("G" & i).Value
    Select Case clust
      Case "black":  clstClr = VBA.RGB(0, 0, 0)
      Case "red":    clstClr = VBA.RGB(255, 0, 0)
      Case "blue":   clstClr = VBA.RGB(0, 0, 255)
      Case "green":  clstClr = VBA.RGB(0, 255, 0)
      Case "orange": clstClr = VBA.RGB(255, 192, 0)
      Case "purple": clstClr = VBA.RGB(112, 48, 160)
    End Select

    '.AddConnector(msoConnectorCurve, "BeginX", "BeginY", "EndX", "EndY")
    Sheet12.Shapes.AddConnector(msoConnectorCurve, bgnX, bgnY, endX, endY).Select

    With Selection.ShapeRange.Line
      .Visible = msoTrue
      .ForeColor.RGB = clstClr
      .Weight = wgt
      .Transparency = 0.5
    End With
  Next i
  Sheet12.Range("A1").Select
End Sub'